|
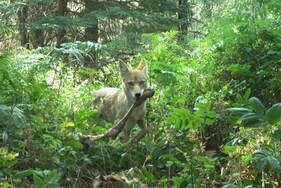
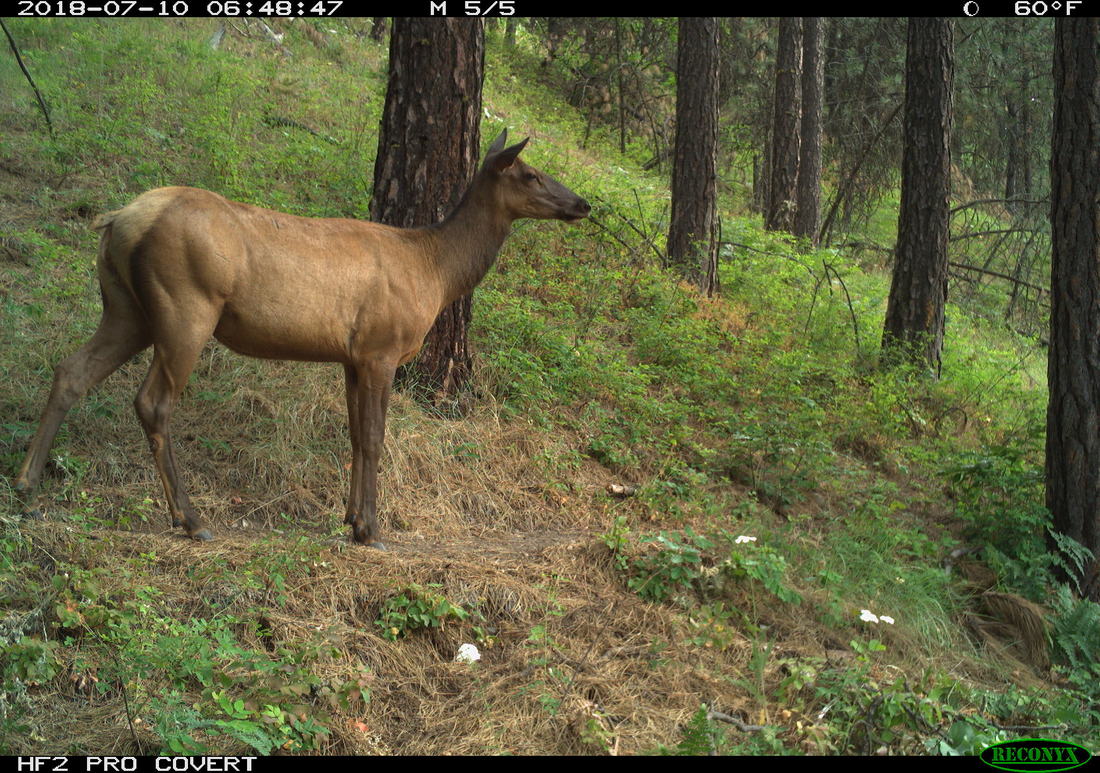
This blog post was originally written for the Journal of Animal Ecology to summarize research findings from Predator-Prey Project's research paper, "Interactive effects of wildfires, season, and predator activity shape mule deer movements". It is reproduced with permission here, and the paper is available online or by emailing the authors to request a copy. Across the American West, wildfires are becoming more frequent, larger, and more intense. In the Methow Valley and Okanogan region of north-central Washington, nearly 40% of the area has burned since 1985. Mule deer, white-tailed deer, moose, black bears, bobcats, cougars, coyotes, and recently returned wolves live across this area. While wildfires can shape wildlife habitat, the impacts of the recent fires on these species – and the interactions between them – is unclear. Given the decline of mule deer across the American West, primarily attributed to changes in habitat, we were especially interested in understanding how mule deer navigated burns while managing predation risk from cougars and wolves. To examine how wildfire impacted mule deer, we captured and GPS collared 150 adult female deer along the Methow Valley and considered their movement as they encountered a range of fire impacts over the year. We also caught cougars and wolves to fit them with GPS collars. Using these predator locations, we mapped which areas they used most heavily, allowing us to consider how mule deer managed predation risk in fire-affected areas. 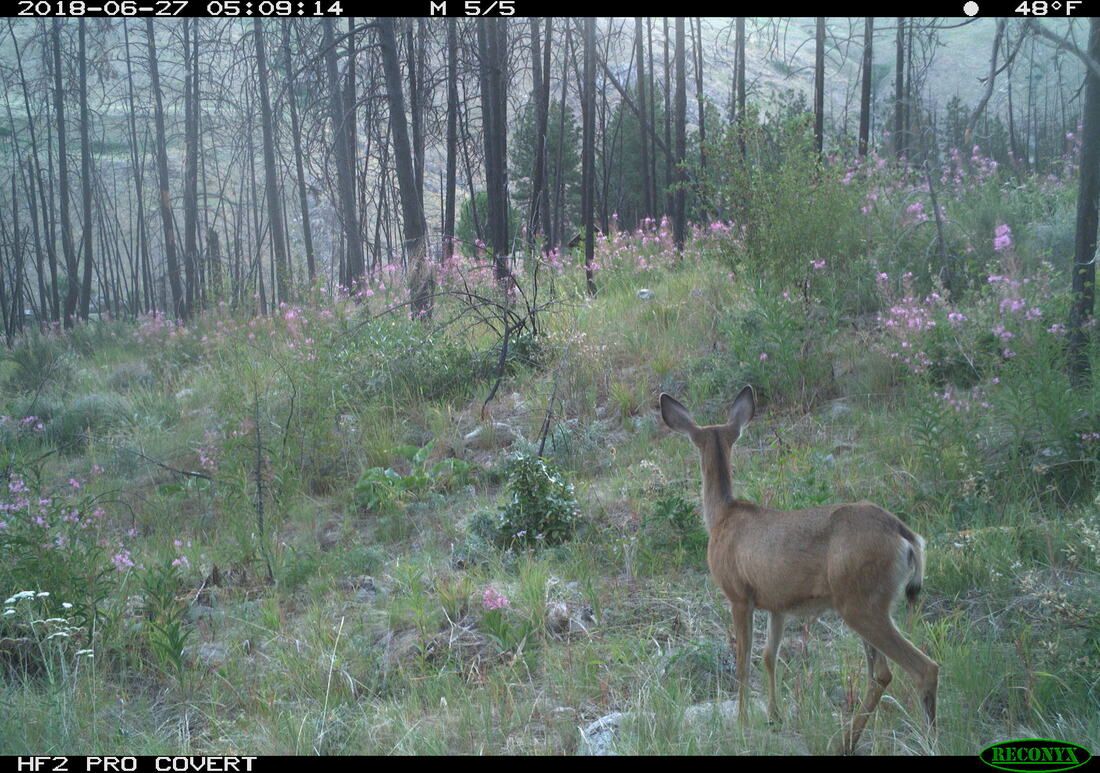 Wildfires tend to increase shrubby and herbaceous vegetation on which mule deer feed. Here, a camera trap image shows a mule-deer doe in a burned forest where fireweed, grasses and shrubs have re-grown. Photo: Sarah Bassing Wildfires can have a wide range of effects depending on the characteristics of the burn. We considered low, moderate, and high severity fires over time spans from 0 to 35 years post-fire. Fires impact forests by initiating nutrient cycling, triggering the growth of fire-adapted plants, burning understory vegetation, and in more severe fires, even removing the forest canopy. Generally, burns increase the shrubby and herbaceous vegetation deer favor for food in the summer. As expected, we found deer tended to select for burns in the summer to access this improved forage. But the growth of this vegetation and increase in deadfall post-fire can also impact the hunting efficacy of predators. Cougars hunt by stalking and ambushing prey, and understory re-growth and accumulation of deadfall provide the hiding cover for cougars to approach deer undetected. Where cougar activity was higher, deer were generally more likely to reduce their selection of burned areas with better forage to avoid an increased risk of cougar predation. Mule deer’s response to cougars in burns also depended on the severity and time since the fire, suggesting that response to cougars reflected the ways that fire restructured the habitat. Deer balanced this food-safety tradeoff, and we found that they were no more likely to die from cougars or other predators in burned areas than in unburned areas. Unlike cougars, wolves hunt by chasing down prey over long distances in open landscapes. Where wolf activity was higher, wildfire created a win-win situation for deer, improving summer forage quality and providing hiding cover from wolves. Because of this, deer were even more likely to use burns where wolf activity was high. Wolves have been naturally recolonizing the area over the last couple of decades. They occur at lower densities in the region compared to cougars, so effects on deer could increase if the local wolf population grows. 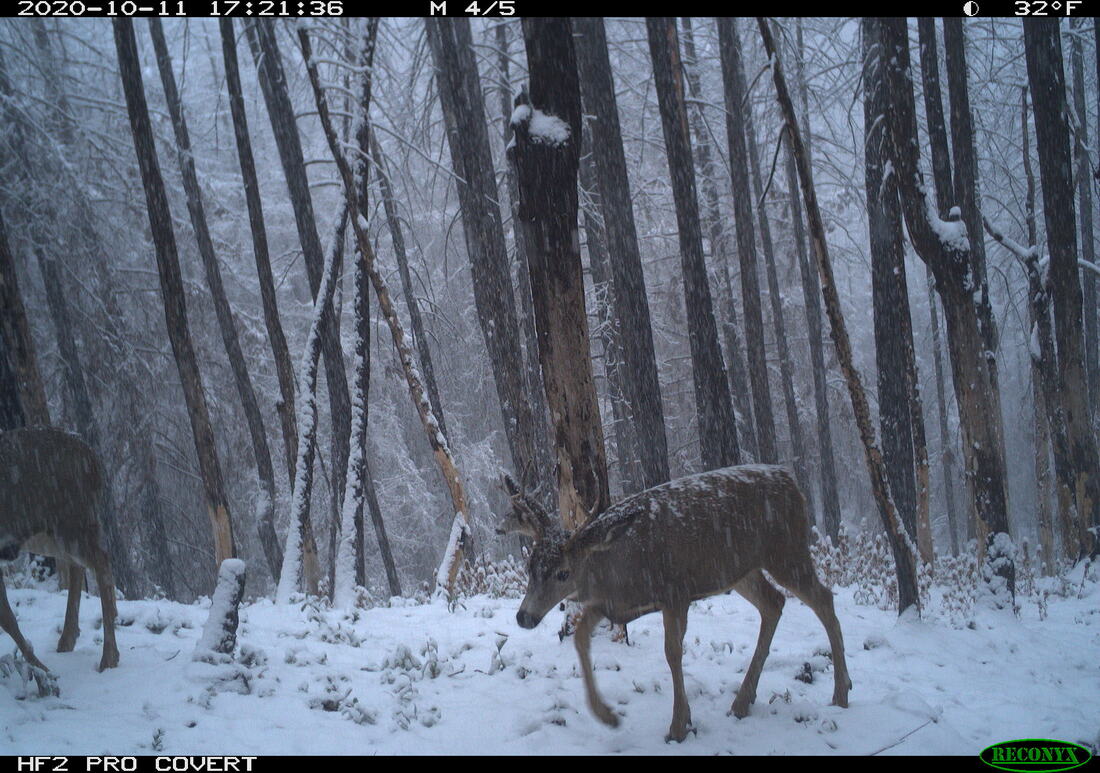 In the winter, snow can accumulate to deeper levels in burned versus unburned forests because snow accumulates in the understory rather than being intercepted by the canopy-cover. In this camera-trap photo, a mule deer buck moves through a burned forest in an early autumn snowfall. Photo: Sarah Bassing In the winter, we found that deer avoided burned areas. When fire removes the canopy cover that would otherwise catch falling snow, deeper snow accumulates in burned forests than in unburned forests. Deeper snow in burns had two effects: First, deeper snow cover would inhibit deer access to the forage buried beneath it. Second, deer struggle to escape from predators in areas of deep fluffy snow where their hooves sink deeply, while predators’ paws act as snowshoes. Still, we found that deer avoided burns more strongly with increased cougar activity and less strongly with increased wolf activity, reflecting the hunting styles of these predators. Our study showed that wildfires impact ungulate species such as mule deer through multiple pathways, shaping food availability and vulnerability to predators with seasonally dependent effects. In snowy areas where burns occur on winter range, these impacts could be concerning if wildfires functionally reduce available habitat for deer when they avoid burned areas. Read the full paper here: Ganz, T. R., DeVivo, M. T., Kertson, B. N., Roussin, T., Satterfield, L., Wirsing, A. J., & Prugh, L. R. (2022). Interactive effects of wildfires, season and predator activity shape mule deer movements. Journal of Animal Ecology, 00, 1–16. https://doi.org/10.1111/1365-2656.13810
0 Comments
During the summer months, our fieldwork consists primarily of visiting wolf and cougar “GPS clusters,” or groups of GPS locations where a wolf or cougar may have eaten prey. We have been tracking collared cougars and wolves in our study areas since December 2016, documenting movements and examining kills and scavenging events. To learn more about how we investigate carnivore feeding sites, see our previous post titled “Why We Study Carnivores Using GPS Collars.” Fires in 2017 and 2018 greatly impacted our ability to do fieldwork, and these fires altered the movement of our collared carnivores as well. The Okanogan study area centered around Twisp, WA has one of the highest rates of lightning strikes in the continental US. Combine this with dry conditions, daily winds, thick understory, and an abundance of Douglas-fir trees, and you have the perfect conditions for large-scale wildfires. 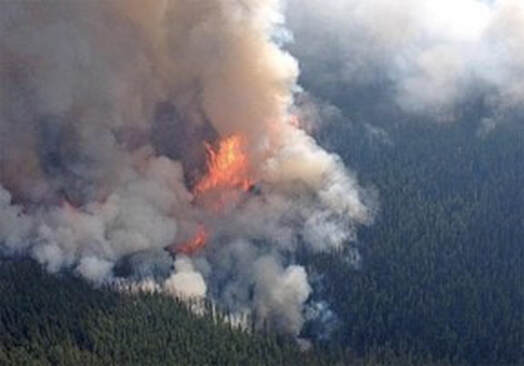 Photo of the smoke and flakes of the Diamond Creek Fire which burned 128,272 acres in the Pasayten Wilderness and surrounding Forest Service land in 2017 (photo: InciWeb inciweb.nwcg.gov). As a result of the fires, we had to suspend fieldwork operations for several weeks in both 2017 and 2018. Thanks to help from the US Forest Service, we were able to take down some cameras that were at the edges of new fire closure zones in 2017. I visited the fire camp and donned a shirt and pants made of Nomex, a fire-resistant clothing made of a nylon-like polymer. Some trail cameras put out across the study areas, meant to track wildlife in different habitat types, were burned in the fires of 2018. The Crescent Mountain Fire in particular was spreading rapidly in its first days due to prime fire conditions, so there was no safe way to rescue nearby research cameras and many were lost in the fire. 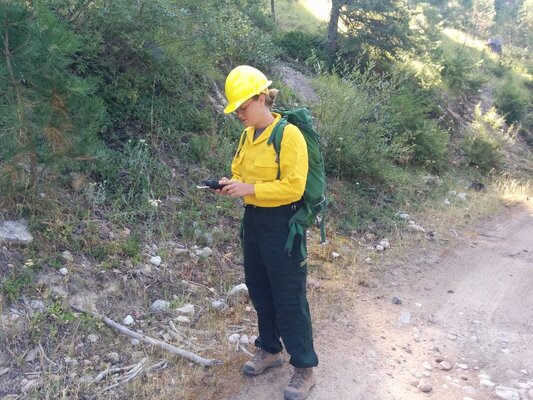 Lauren Satterfield, wearing Nomex clothing, preparing to retrieve a camera from an area at risk of burning in Diamond Creek with logistical support from USFS. Over 60% of our Okanogan study area has burned due to natural or human-caused wildfires and prescribed burns since 1900. Fire affects food availability for deer, at first removing a lot of vegetation but later fostering nutritious new growth in the years after disturbance. These growth periods are known as “seral stages,” and we predict that they will have an impact on deer movement and survival. As a result, carnivores will also be affected by where food is available for deer post-fire. Fires can also change landscape structure, making an area more open. This might make it easier for cougars or wolves to spot deer, and fallen logs known as “blowdown” may make it harder for deer to escape these post-fire zones. Thus, disturbance events like fire might both benefit deer by providing forage and change predator-prey dynamics by altering hunting conditions for wolves and cougars. 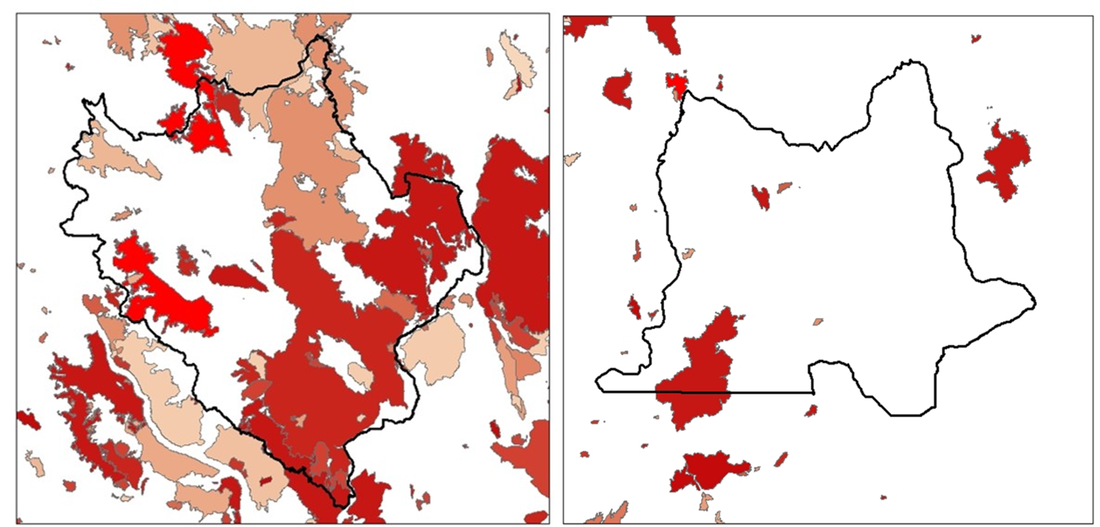 Map of fires in the Okanogan (left) and Northeast (right) study areas going back to 1900. Brighter red colors are more recent fires, with faded tones indicating older fires. The 2017 Diamond Creek Fire and 2018 McLeod and Crescent Mountain Fires are in the brightest shades of red on the north and west boundaries of the Okanogan study area while the 2018 Boyds Fire can be seen on the northwest corner of the Northeast area. To learn more about wildfires in the western USA, watch this talk by Paul Hessburg of the US Forest Service given at TEDxBend titled, “Why Wildfires Have Gotten Worse and What Can We Do About It?”
https://www.ted.com/talks/paul_hessburg_why_wildfires_have_gotten_worse_and_what_we_can_do_about_it?language=en - Lauren Satterfield
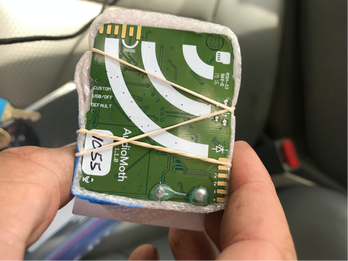
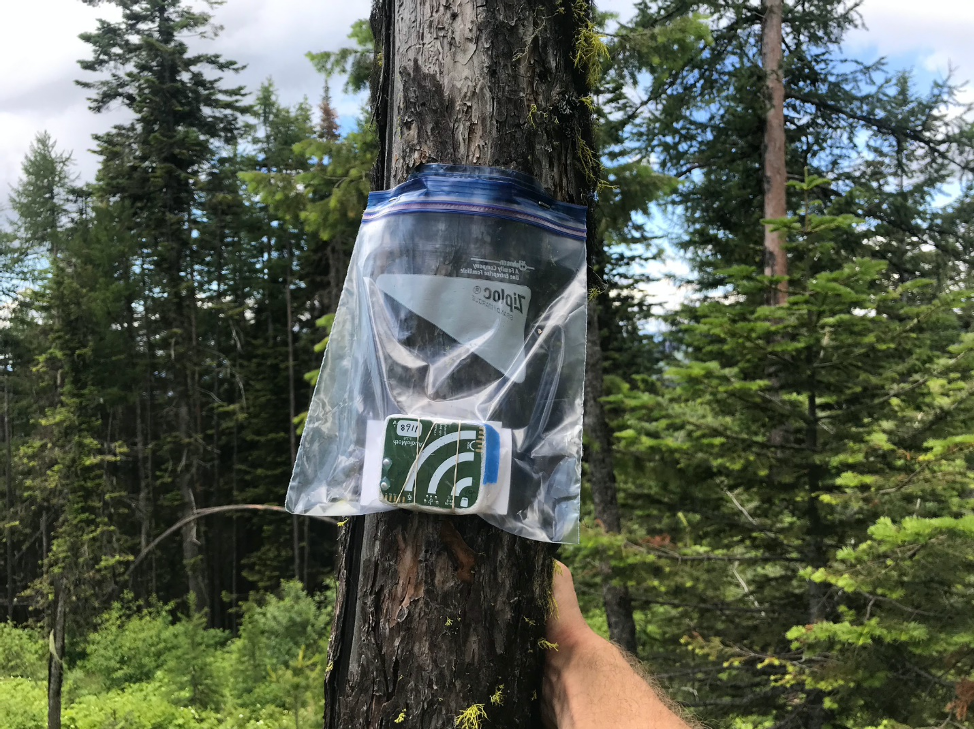
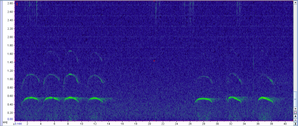
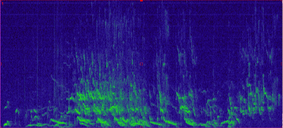
Wolf howls have a unique frequency range and characteristic shape, making them easy to detect visually when we look at a spectrogram (a graph of the sound frequencies; see below for example). This allows us to easily examine sound recordings for signs of wolf presence (we will collect ~63,000 hrs of recordings in 1 summer, which would take over 7 years to listen to them all). In fact, after collecting recordings of the sounds, we can process these data using machine learning techniques which automatically identify likely wolf howls. This means we don’t actually listen to any of the sounds except to verify the “howls” returned by the machine learning program. Interestingly, coyote howls, which you might think could be confused with wolf howls, have a rather different frequency and thus it is often easy to distinguish the two without listening to the recording.
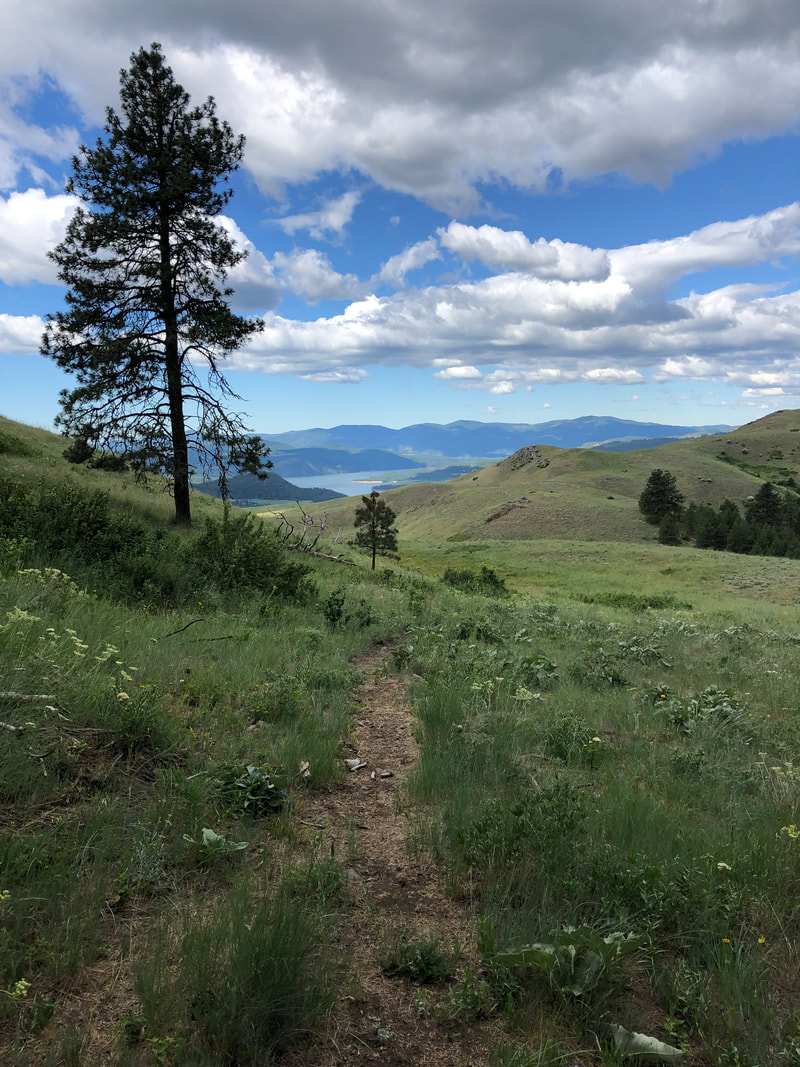
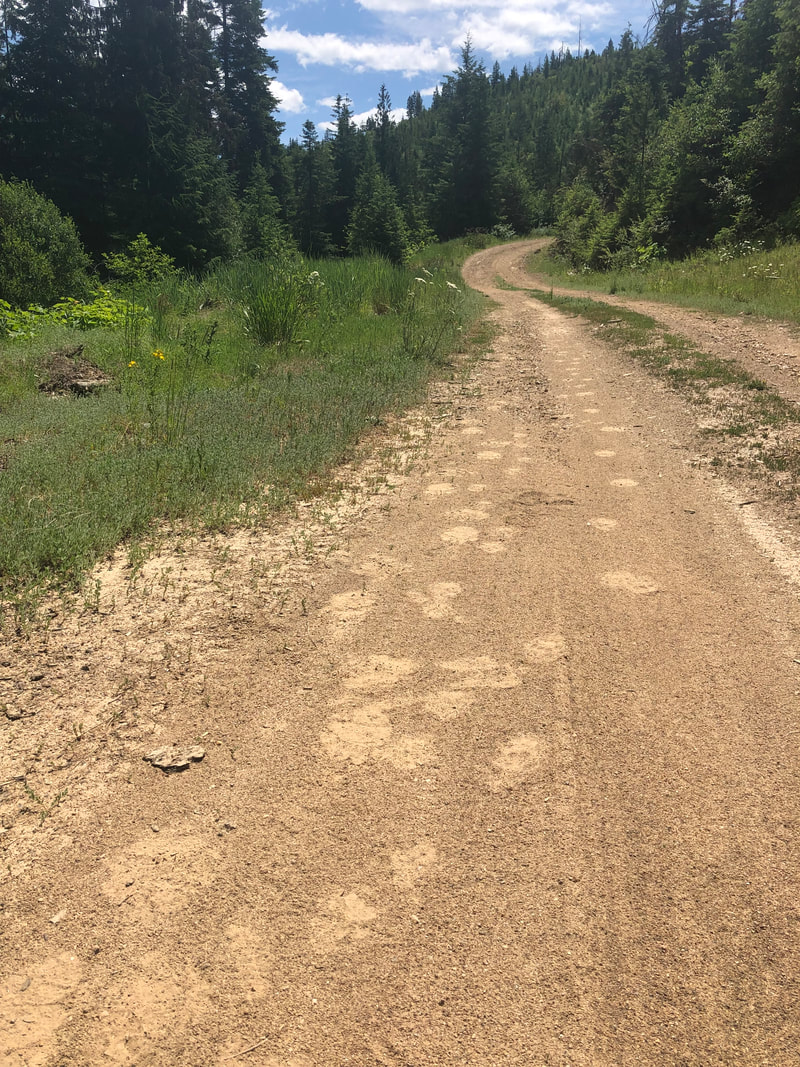
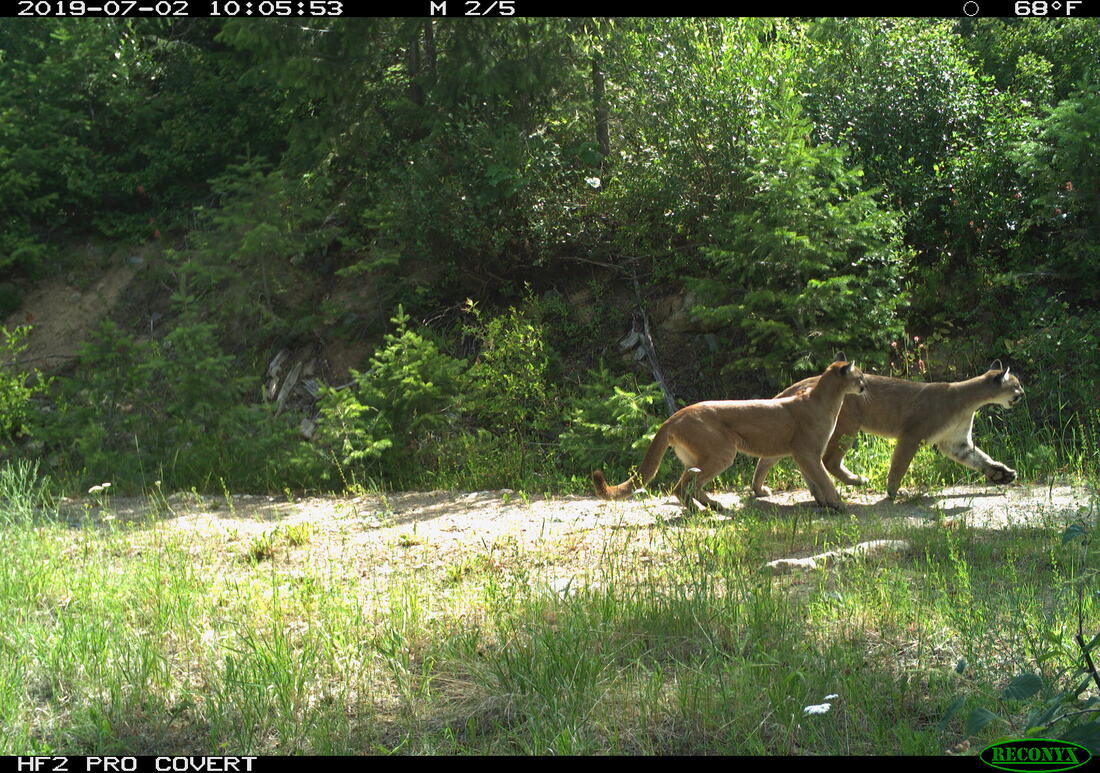
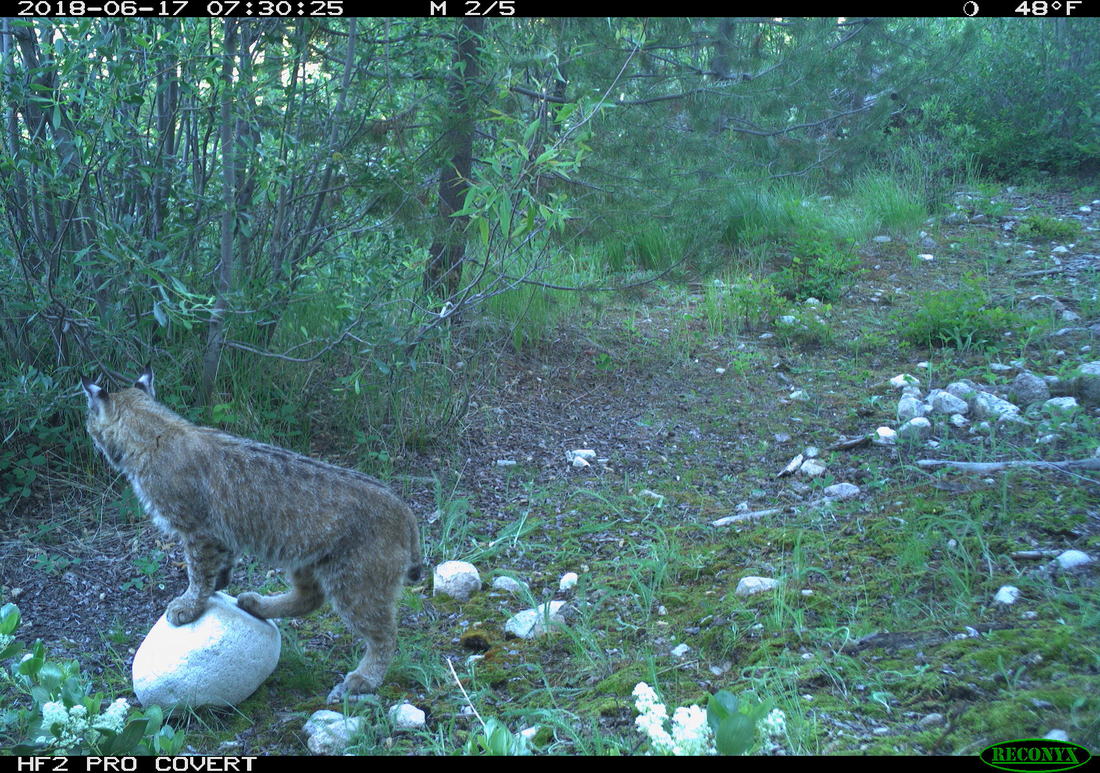
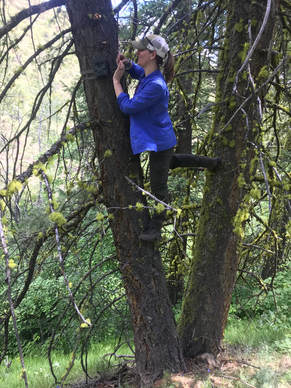
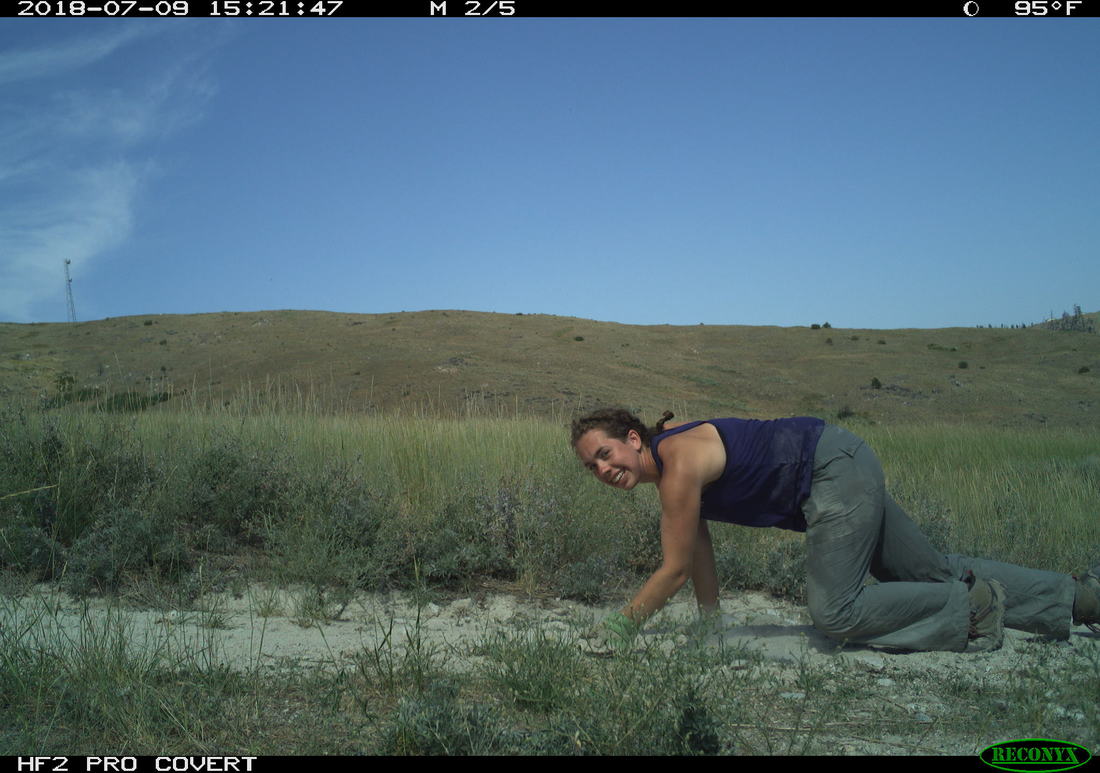
Once we process the data, we can use the recorded howls to start to understand different aspects of wolf populations. First, we will learn when and where wolves are howling across the landscape. This can help identify new packs in new locations. Second, we can look at the spectrograms and identify how many unique wolves are howling in any recording, which can provide a minimum count per pack. And finally, we can also determine the presence of pups in the pack through their own unique howl frequency, which can provide information on recruitment. These are all rates that that have proven challenging to monitor through collaring and camera trapping, but we hope to incorporate AudioMoths as a new inexpensive tool to monitor wolves on larger spatial areas with greater efficiency while improving our confidence in some of those population metrics. 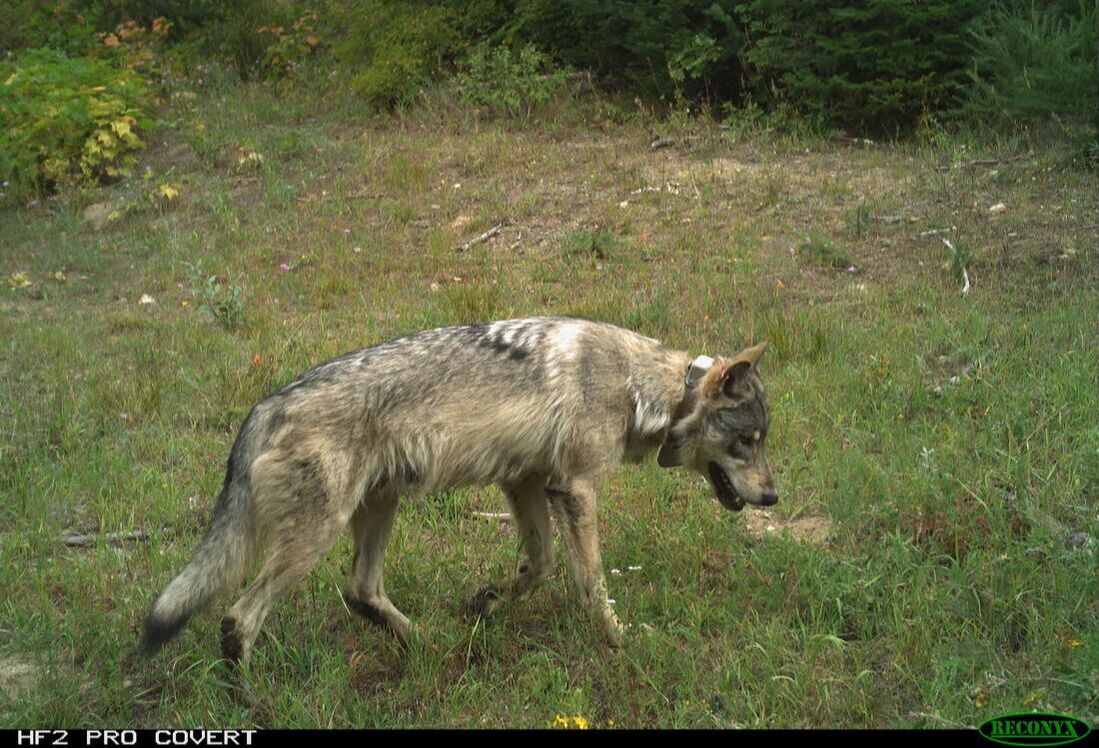 This radio-collared wolf was detected by both a camera and AudioMoth last summer, allowing researchers to compare techniques for monitoring wolves. We use camera trapping to address a number of research questions on the Washington Predator-Prey Project. In principle, camera trapping is simple. You place a camera in the field, turn it on, and wait in anticipation for the day when you get to flip through all the amazing photos of animals that your camera collected. In practice, camera trapping is a bit more complicated than that, and how you set up your camera can make a world of difference in the species you detect and the quality of information you collect (Burton et al. 2015). Take, for example, our use of camera traps to better understand how predator-prey interactions influence habitat use [Community Dynamics] for different species in Washington. Because we are targeting a variety of species with our camera traps (e.g., bobcats, wolves, and elk), we have to place cameras across the landscape in a way that gives each study species some probability of being detected on camera. This means we use a random sampling approach to pick camera locations, where we randomly pick places across the study areas to deploy a camera, regardless of habitat type, land use, or accessibility from a road. Using a random sampling design should increase our chances of detecting a diversity of species that are representative of the animal community in the study area because our cameras are surveying an unbiased variety of habitats (O’Connell et al. 2011). 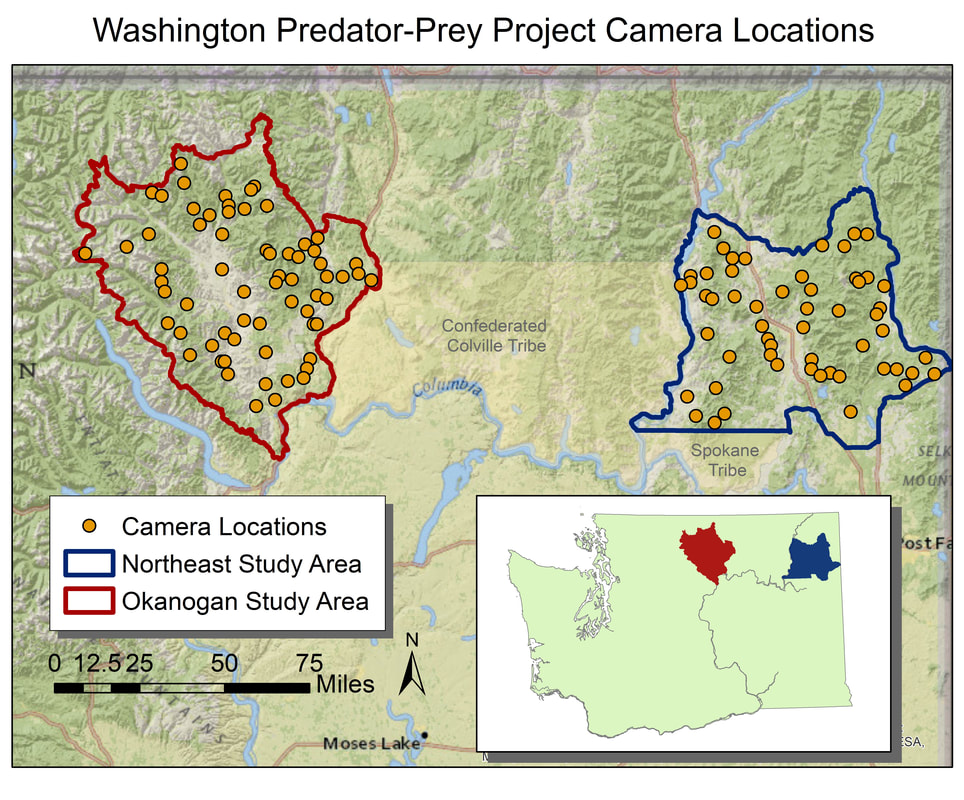 Map of random locations to guide camera trap placement across WPPP study areas. Once we get to that location (always with permission from the property owner), we need to set up the camera in a location where it has a high probability of detecting any species that uses that area. Because we are targeting both predators and prey species, we place cameras on game trails and roads. Although these linear features are not truly random locations on the landscape, they tend to funnel animal movement in predictable ways and placing a camera here can increase the chance of photographing rarer species, like wolves (Cusack et al. 2015). Examples of good roads or game trails to place a camera trap on. Both are relatively flat and straight with several trees to attach cameras to. Notice the fresh bear and cougar tracks in the dust on the road. When picking the exact spot for the camera, we consider whether a section of road/trail is flat and/or straight, both of which make angling the camera easier. We also look for animal sign to give us an indication of which species we might expect to see on camera. We generally attach cameras to trees or fence posts that are close to the road/trail. Sometimes we feel like “Goldilocks” when trying to find the perfect object to attach the camera to. It can’t be too close, but also not too far. It can’t be attached to something too small in diameter, but also not too large. And the camera can’t be too low to the ground, but also not too high. Distance and height of the camera influence how likely you are to get a good photo of an animal as it passes by (Meek et al. 2016, Jacobs and Ausband 2018). And diameter matters because if the tree is too small, it will blow in the wind and cause the camera to trigger unnecessarily. Too big, and the strap we use to attach the camera wont’ fit around the tree! 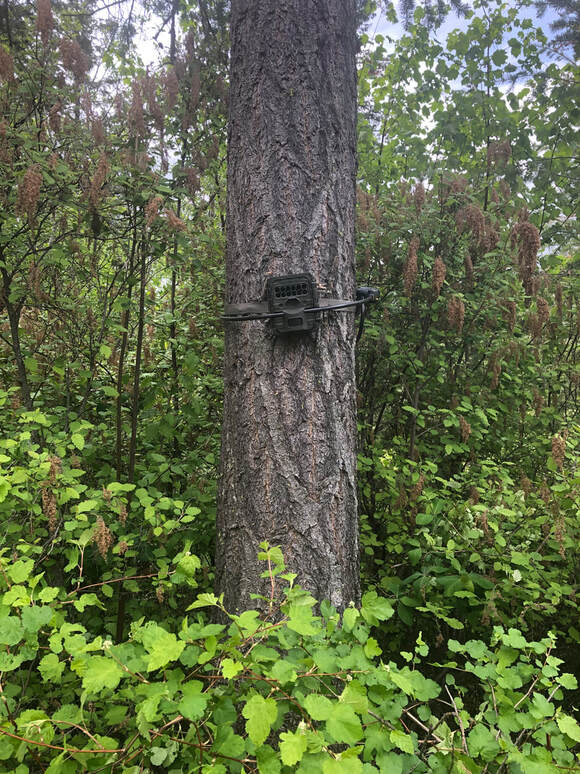 Final camera deployment. The camera looks a little off-kilter but this is to match the slope of the road it is monitoring. Once we find a satisfactory location to set up the camera, we have to test the camera’s aim. Subtle differences in the slope and curvature of the road/trail or slight differences in the angle of the camera can greatly influence whether the camera will trigger the way we expect it to. We want to make sure the camera will trigger on an animal walking from any direction and that it will trigger on large and small species (e.g., moose and bobcats). We therefore test the camera’s trigger by walking and crawling past the camera in any direction we think an animal might go. It may seem silly to imagine a scientist crawling around on all fours in the woods (indeed, it does look silly), but this ensures that we collect the highest quality data possible and minimize the chances of missing a detection just because the camera wasn’t set up properly. Once we are satisfied with how the camera is triggering, we turn it on and wait in anticipation for the day we can retrieve the memory card and find out which species used our camera site. 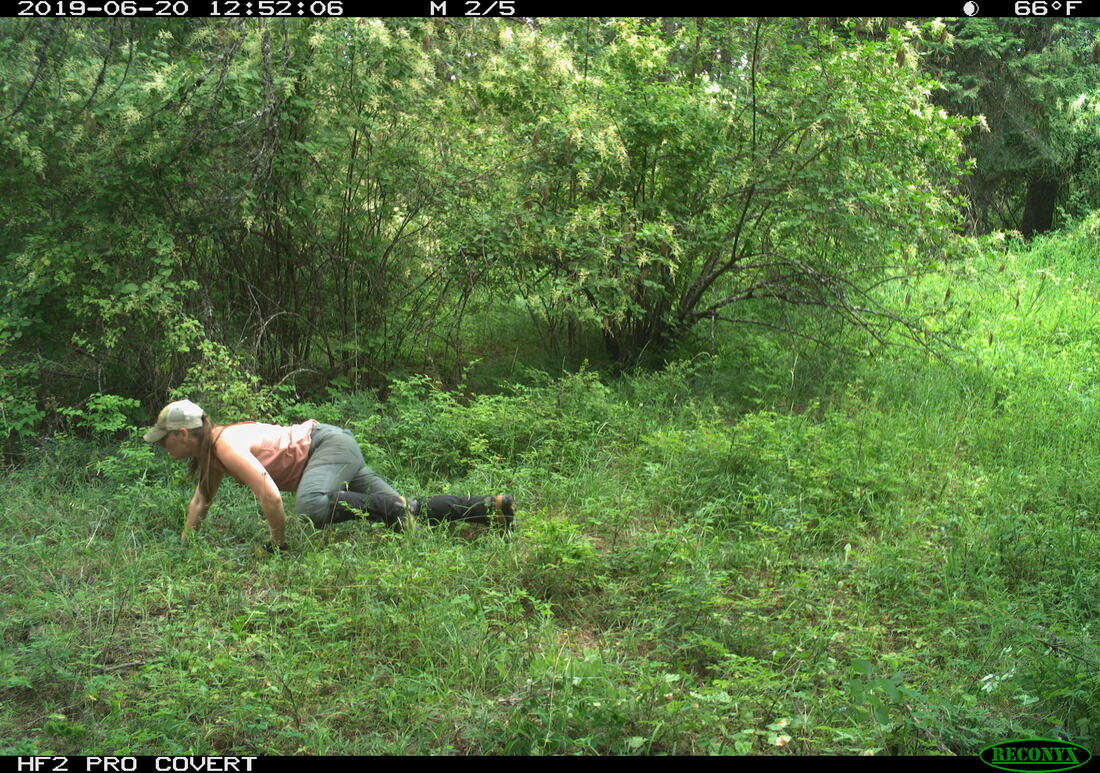 We often crawl low to the ground in front of the camera to mimic the height of a carnivore (i.e., "carnivore crawl"). This helps us ensure that the camera trap will trigger on animals of different sizes. Example of some of the many species we detect on camera. Notice the bull moose is actually walking along a game trail that intersects with the road. We intentionally placed the camera at this intersection to capture this kind of movement and trail use. The pair of young cougars passed by on the road soon after. Watch a timelapse video of UW PhD student, Sarah Bassing, and 2019 summer field technician, Parker Levinson, deploy a camera trap. Note how we walk and crawl in front of the camera multiple times to make sure the camera is triggering properly. We take final measurements, such as the camera's height and distance to road, once we've finished placing the camera. 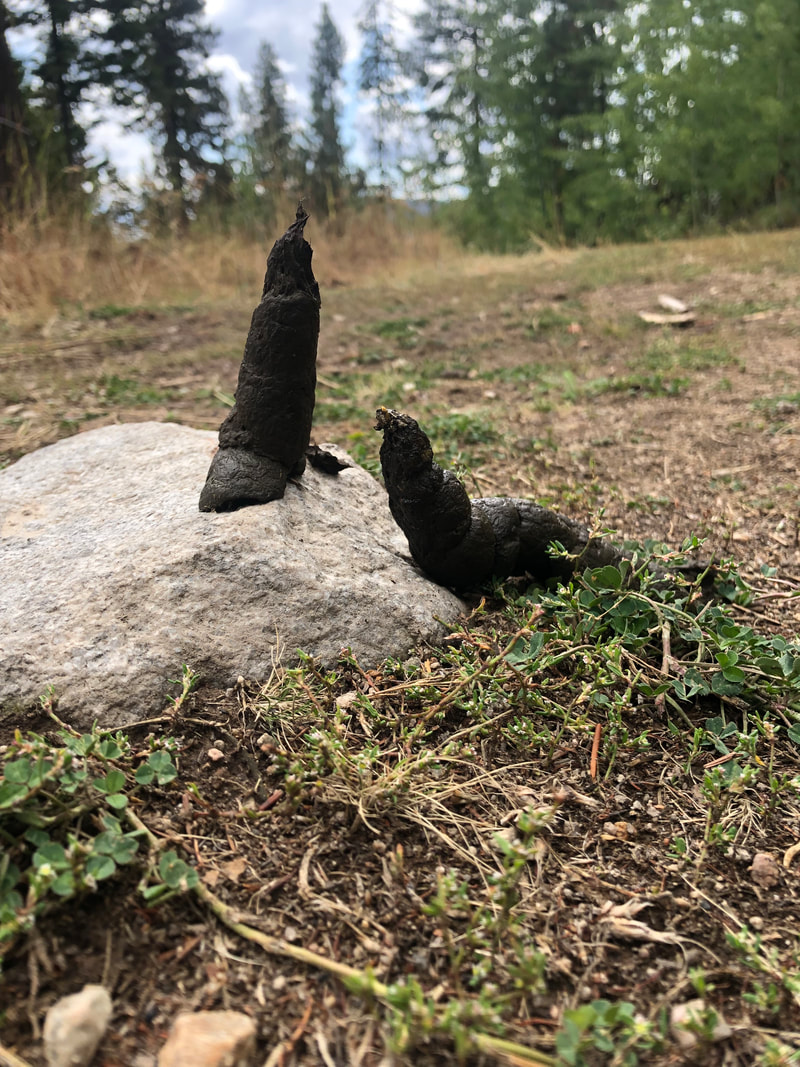 A nice, fresh coyote scat. Morphological characteristics, such as the tapered ends on this scat, can be used to ID scats in the field. Photo Credit: Anna Machowicz A nice, fresh coyote scat. Morphological characteristics, such as the tapered ends on this scat, can be used to ID scats in the field. Photo Credit: Anna Machowicz The mesopredator portion of the WA Predator-Prey Project focuses on understanding the behaviors and population dynamics of coyotes and bobcats, the predominant middle-sized predators here in Washington. To study these animals we collect a wide variety of data. We deploy GPS collars on coyotes and bobcats to track their movements, place remote wildlife cameras on ungulate carcasses to document scavenging behaviors, and to measure population characteristics like density, we pick up a lot of poop. Yes, poop. Or scat, or feces, or excrement, or whatever you want to call it; doing poop science is an incredible, non-invasive way of tracking cryptic, wide-ranging species like carnivores. Here is how it works: When we find a scat, we know that an animal was there, in that exact location, at some recent point in time. We record the location of the scat with a GPS device and then do our best to identify it to a species level. Coyote? Bobcat? Wolf? Bear? Cougar? We look at both morphological characteristics – Size? Segmented Pieces? Tapered Ends? – and contents – Hair? Bones? Berries? Grass? – to help us make our determination of which species the scat belongs to. Some scats are easy to identify, but others can be quite challenging! Next, if the scat looks to be on the fresher side, we collect a genetic sample. The fresher a scat is, the higher the probability that we can successfully genotype the sample. However, we have been able to successfully genotype scats estimated to be a couple of months old, so we collect any scat that is still looking relatively fresh. Scat contents are made of waste materials that can be useful to assess the animal’s diet, but dead epithelial cells that line the gut and slough off on the outer surface of each poop are what we are after for genetics. These epithelial cells are collected by swabbing the surface of a scat and the DNA within the cells can then be used to tell us a whole bunch of things about the animal that pooped. In the lab, we use mitochondrial DNA within cells to check and make sure our field identification (ID) of species was correct. Mitochondrial DNA is inherited only from your mother and as a result, can be used to efficiently tell species apart. Our crews correctly identify scats 8 out of 10 times in the field – not too shabby! – but genetics allow us to confirm field IDs and fill in gaps when certainty is low or an ID is incorrect. After species identification is verified, we can find out exactly who took the poop by looking at animal’s nuclear DNA. This is possible because nuclear DNA comes from a unique combination of the animal’s parents, allowing us to tell individual animals apart. Species and individual identifications are extracted from swabbed DNA at the SEFS genetics lab at the University of Washington, where the individual identifications in turn allow us to make inferences about the population characteristics we are researching. 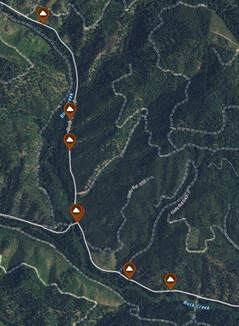 An important part of doing poop science is having good information about where and when you found each scat on the landscape. We use this information in combination with individual IDs from genetics to understand population dynamics. An important part of doing poop science is having good information about where and when you found each scat on the landscape. We use this information in combination with individual IDs from genetics to understand population dynamics. To make population inferences, we use results from genetic analyses (i.e., the individual IDs) in combination with the location of where we found each scat (i.e., spatial information). By finding multiple scats from the same individual across both space and time we can use models to get a basic idea of where each animal lives, and how many animals of each species reside in our area of interest.
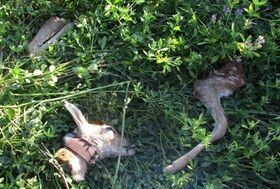
Poop science (or fecal genotyping in scientific terms), along with other methods that capitalize on the non-invasive collection of animal DNA, are rapidly advancing and can be used in conjunction with a variety of models to study wildlife populations. In addition to doing poop science, the WA Predator-Prey project uses DNA to investigate a variety of questions (see the When Deer Die post!) and these genetic investigations are only a few of the extensive methods that are being used to investigate predator-prey interactions in Washington. - Becca Windell 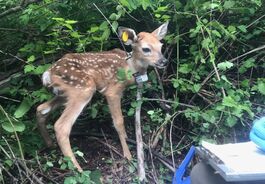 The radio collar's signal changes if it stops moving for a programmed period of time, indicating that the animal is dead or the collar has fallen off. The radio collar's signal changes if it stops moving for a programmed period of time, indicating that the animal is dead or the collar has fallen off. When I was very young, maybe 4 or 5, I had a collection of dead bees. I found my specimens dead on the sidewalk, floating in a swimming pool, or lying in the corner of a sunny window ledge. At my behest, my mom would wrap the lifeless insect in a paper napkin, stash it in her purse, and bring the tiny carcass home for my collection. I stopped accumulating bees after a few years but remained fascinated by dead things. Over the years, I’ve found a desiccated frog on a granite slab, a Vaux’s swift cradled in an icy sun cup on a glacier, and the broken body of a red-tailed hawk lying between jagged rock outcroppings. These encounters and others like them stick with me. I still find myself wondering: Where did these animals travel? How did they end up there? Why did they die? It should come as no surprise then that in studying carnivore-ungulate interactions, it’s often the deaths of deer and elk that I find most interesting. While many of us glimpse animals through binoculars or the camera lens, it’s a rare privilege to document the bookends of their lives. We collar neonates shortly after birth, and for some of those, we later investigate their deaths. When they die, it’s our job to piece together what happened. First, we look for tracks and sign around the scene. Paw prints and scats indicate which species have visited the site, and drag trails from a cached carcass can reveal blood-soaked earth or lead to a kill site. Bears often leave scratches on tree trunks, and carnivore hairs get caught in low branches. Using a microscope, we can identify which species left those hairs. We map out the comings and going of the scavengers, and look for signs of prey struggle.
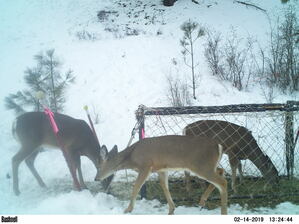
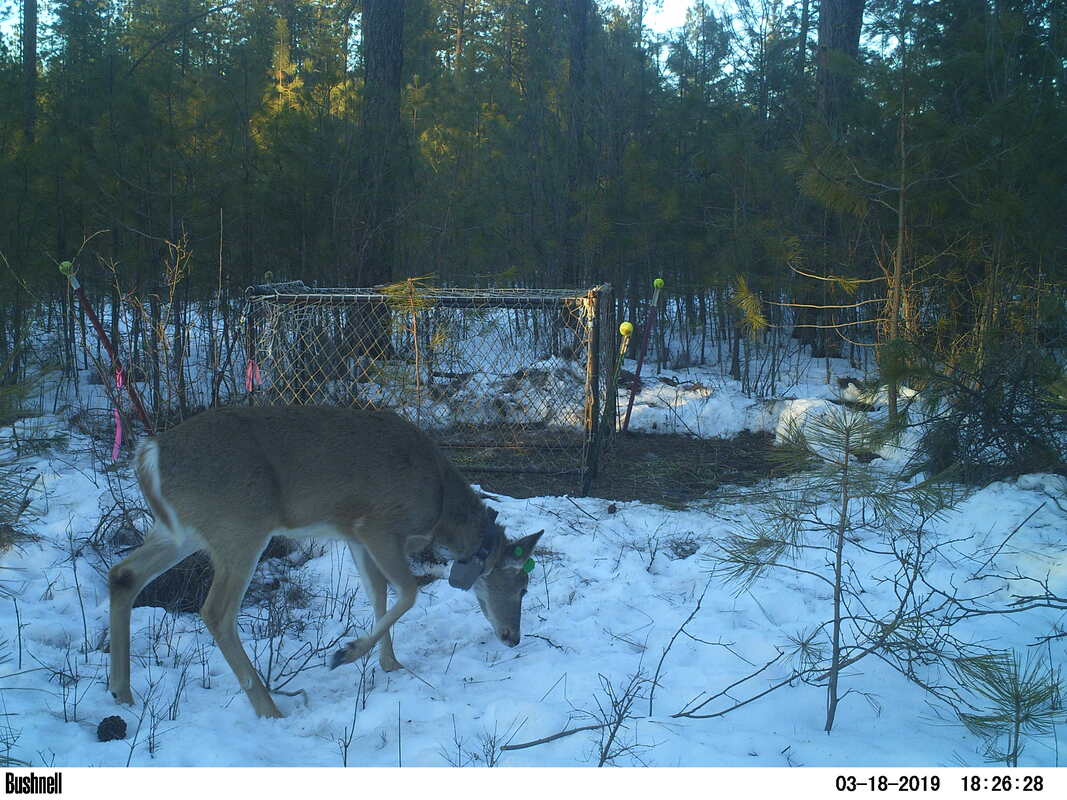
The condition of the remains adds more to the story. Coyotes, wolves, and dogs scatter a carcass. Bobcats and cougars cache them. Cats eat the internal organs first, but leave the stomach intact, even placed delicately to the side. Bears peel back the hide and chomp on limbs – bones and all - like they’re hot dogs. Such clues indicate the scavengers that have visited, but they don’t reveal why the ungulate died. For this, we get under the skin, performing a necropsy, or autopsy of an animal. Methodically, we dissect the carcass searching for clues: starvation saps the marrow of fat, leaving it red and gelatinous; disease can lesion the affected organs; vehicle collisions shatter bones and organs. We can identify predation by finding hemorrhaging at the site of lethal bite wounds. These factors don’t always occur in isolation – a sick deer may be a starving deer, and a sick or starving deer is easier for a predator to catch. In cases of predation, we swab predator saliva from the exterior of hemorrhaged bites and later analyze the DNA in that saliva to confirm the predator. Where the substrate is poor for tracking, such as pine duff, and consumption patterns are unrevealing, this technique can be the lynchpin in cracking the case. It can also help us identify a cause of death when many scavengers have fed at a carcass. Each tool on its own has its limits. Considering the clues together, we can often piece together the story of the deer or elk’s demise. Collectively, mortality investigations allow us to examine how different factors influence prey populations over time and across the landscape. - Taylor Ganz Spring is a time of transition at the WA Predator-Prey Project. After spending the winter collaring white-tailed deer in northeastern Washington, I’m back in the lab in Seattle. Every few mornings, I log into my computer to view the current locations of the deer we’ve captured and fitted with GPS collars this winter. A small colored dot represents each deer, resembling pushpins pressed into a map on a corkboard. Every day, the GPS collars record their locations and beam that information to us via satellite. Day-by-day, the dots creep across the map of northern Washington, plotting the path of each animal as they transition from winter ranges to summer habitats. It’s a rewarding feeling, seeing these data stream in, after a winter of grueling but productive field days to deploy these collars. Winter means capture season in the world of cervid research. As the snow piles up in the high country, deer move onto winter ranges where forage is more available and movement is easier. These are the areas we target for capture efforts. This winter, the WPPP focused on deploying more collars on white-tailed deer to improve our understanding of the factors influencing their movement and population dynamics. Our efforts paid off. Over 80 days, we collared 65 white-tailed deer does and 23 white-tailed deer fawns, averaging more than one deer collared per day of effort. Because the survival of bucks has less of an influence on deer population dynamics, we released them when they were captured. Luckily for us, they had also shed their antlers first. Primarily, we catch deer using clover traps. These are large, box-shaped traps specifically designed to catch deer. The traps have padded metal frames and soft netting sides and tops. Once a deer is in the trap, we collapse the trap frame like a cardboard box flattened for the recycling bin, allowing its soft net sides to contain the deer so we can restrain and then collar it.
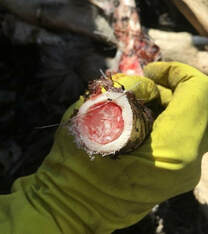
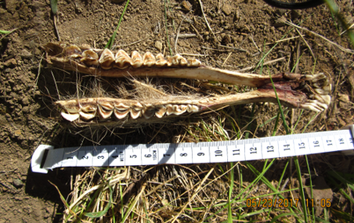
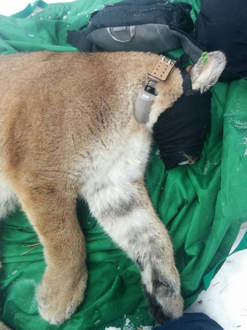
Traps are propped open on one end and baited at the other to attract deer. A hook holds the door open until deer enter the trap to feed, tripping a wire, which pulls the hook and drops the door. It’s a simple but effective system. We bait outside the traps with alfalfa and apples to attract deer to the site, and lay grain and alfalfa inside the trap to entice deer in. Deer aren’t the only animals that visited our traps, and finding the occasional surprise turkey inside a trap left our whole field crew laughing. Fortunately, larger bodied ungulates like moose and elk are too big to enter these traps. 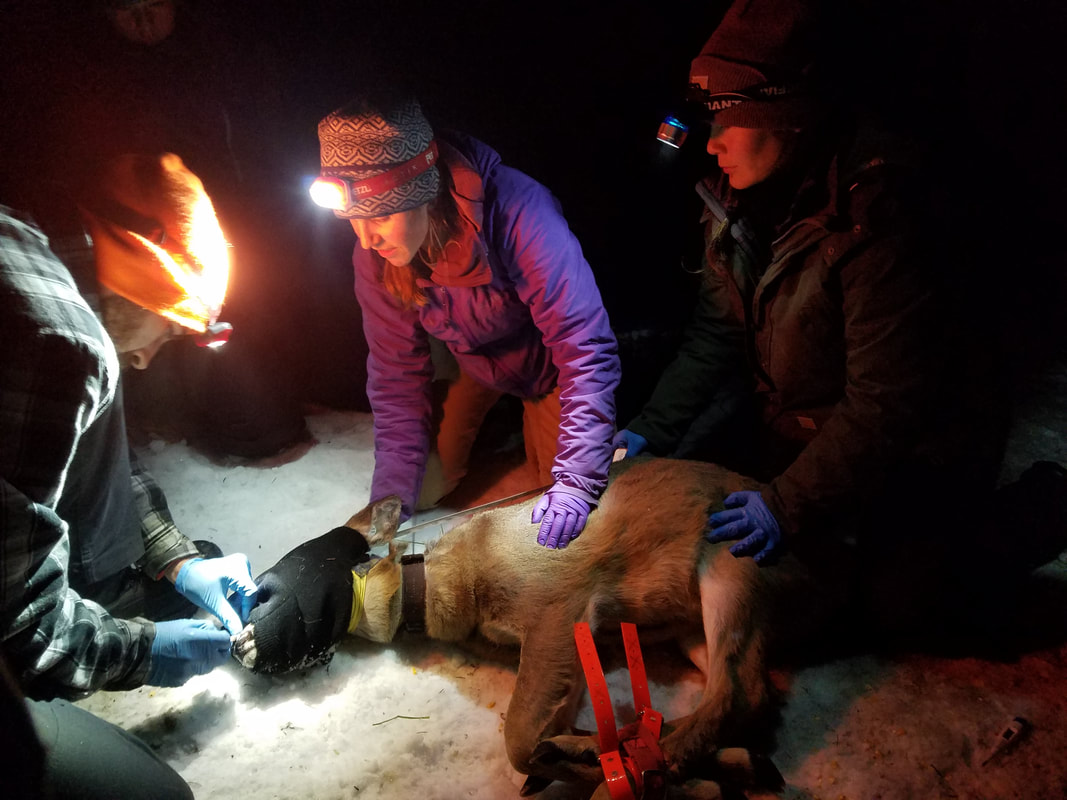 Trap transmitters alert us when a trap has triggered and our crew responds quickly. Deer are largely crepuscular, so we frequently collar animals at night. During a capture we fit deer with a GPS collar and record data about that animal. We collect and test blood to determine pregnancy (important for understanding population dynamics), examine body condition, take morphometric measurements, and attach ear tags so we can recognize individual animals from a distance. Once we finish the workup, deer are released, and we can remotely track their movement and survival. Come June, we'll return to these marked individuals to try and collar their fawns (see my previous post), allowing us to follow the next cohort of individuals. Until then, it's time to catch up in the office and watch the dots creep across the map. - Taylor Ganz Why do we put GPS collars on wolves, cougars, and other wildlife? Why are these collars effective research tools and what are we hoping to learn? Research collars allow us to track individual animals. This can help us understand specific behaviors, such as the size of female cougar territories versus male territories, or how animals move around on the landscape. We can also use collars to locate animals for visual observation studies, such as by locating an elk herd and then watching those elk to see which plant species they choose to eat at certain times of year. Or we can use collars to find sites important for the species we follow, such as where they choose to den and raise young. 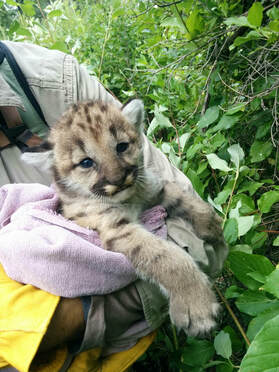 Kitten tagged in June 2017 by tracking a collared female cougar in our Okanogan study area. How do the collars work? Collars are programmed differently based on research goals. For this project, all of our collars record a GPS location every four hours, totaling six points per day. Each point takes a little bit of battery life, so we have to balance the detail of our data against the length of time we want the collar to last. Collar locations let us understand what wolves, cougars, deer, and elk do throughout the day and year, and in relation to one another. Are cougars and deer both resting in dense forests during the heat of the day? Are cougars following mule deer migrations or staying put? Collars can help us answer these questions. 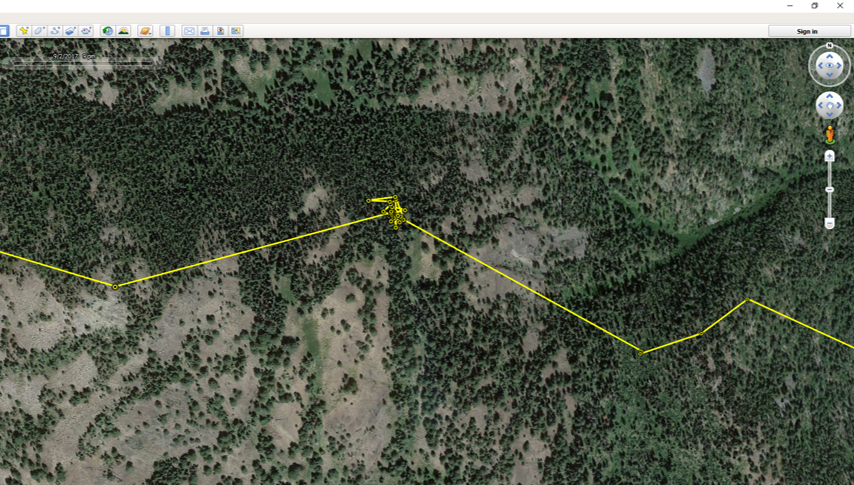 Cougar GPS points in yellow. Each yellow dot represents a GPS point taken by the collar. The grouping of points in the center the of line is a "GPS cluster", and indicates that the cougar stayed in one location for several days, possibly to feed. Lines between points are drawn automatically but do not represent the actual path of the animal. Investigating Kill-sites Collars can also help us find places where a cougar or wolf has killed an animal. When a predator makes a kill, it stays in the area for anywhere from a couple hours to a couple days to feed. When we see GPS points start to pile up, we hike in to those spots to see if the animal was just resting or if it was feeding on a kill. We call these spots “GPS clusters” and they help us find “kill-sites” where predators killed (or scavenged) prey. By investigating these spots, we can gather information on the species, age, and sex of prey by examining the bones left at sites. Age can be determined by looking at the pattern of teeth in the mandible (jaw) or by analyzing the deer’s incisor teeth for cementum annuli, which involves counting years of growth like rings on a tree. We can also get an estimate of the prey’s body condition by looking at bone marrow. White, solid bone marrow has a lot of fat, meaning the animal was not in critical condition. However, red jelly-like bone marrow indicates low fat reserves, suggesting that the animal was in very poor condition.
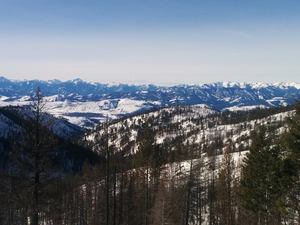
Information from clusters can help us understand which deer and elk are most at risk of being eaten by wolves and cougars. Is it young animals or older ones? Males or females? We can also learn how the landscape might influence predation. Do wolves steal or scavenge cougar kills that occur within their territories? Do cougars kill more deer in burned areas or unburned areas? Do wolves make more kills in areas with a lot of roads or in large blocks of undeveloped land? All of this information will be used to understand how habitat, land management, terrain, and prey behavior influence wolf-cougar interactions in eastern Washington. - Lauren Satterfield January 2018 brought a new season of cougar captures for the Wolf-Cougar Project. When capturing cougars for research, winter is the best time to find these large felines. Snow makes tracking easier, and both cougars and the animals they eat congregate at lower elevations in valley bottoms to avoid the deep snow accumulating up high. Not to mention that a blanket of snow atop Washington’s conifer forests make for a scene worthy of a Bob Ross painting.
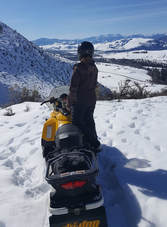
We catch cougars using either box traps or with the help of local houndsmen and trained hounds. Box trapping allows us to capture cougars in areas with more roads and private lands, whereas hounds help us cover larger amounts of ground in National Forests. Of sixteen cougars captured in 2016/2017, six were still alive in 2018. Ten were no longer part of the study due to either collar failure or mortalities caused by hunter harvest, agency removals, starvation, being killed by other cougars, or unknown factors. Why Cougars Die Hunting, agency removals, disease, starvation, and intra-species conflict can result in death for cougars in this region. The cougar hunting season runs throughout the winter in Washington, Idaho, and Canada, with many cougars taken when hunters are out looking for deer or elk. Young cougars stay with their mothers until approximately 18 months of age, looking like full-grown adults before they disperse. These “teenage” cats, known as subadults, sometimes do not have the hunting skills needed to make it through their first year on their own, while other times they wander into the territories of adult cats. Subadult male cougars in particular can die in territorial disputes with other adult males. Our research will allow us to better understand the different causes of mortality for cougars in Washington, and how a growing wolf population might be impacting cougar survival. Cougar Collaring Our goal for last winter was to deploy at least twelve more collars across our two study regions to help us understand how these large cats interact with wolves, the other large predator in the region. A typical winter day starts out by warming up snowmobiles and donning enough layers for a full day outdoors. Last winter, temperatures were markedly warmer, with most days around 30F instead of the frigid temps during the winter of 2016-2017 which could reach -15F. We do not capture cougars in temperatures below 5F, but we’re often out in colder temperatures looking for tracks and making plans for warmer days!
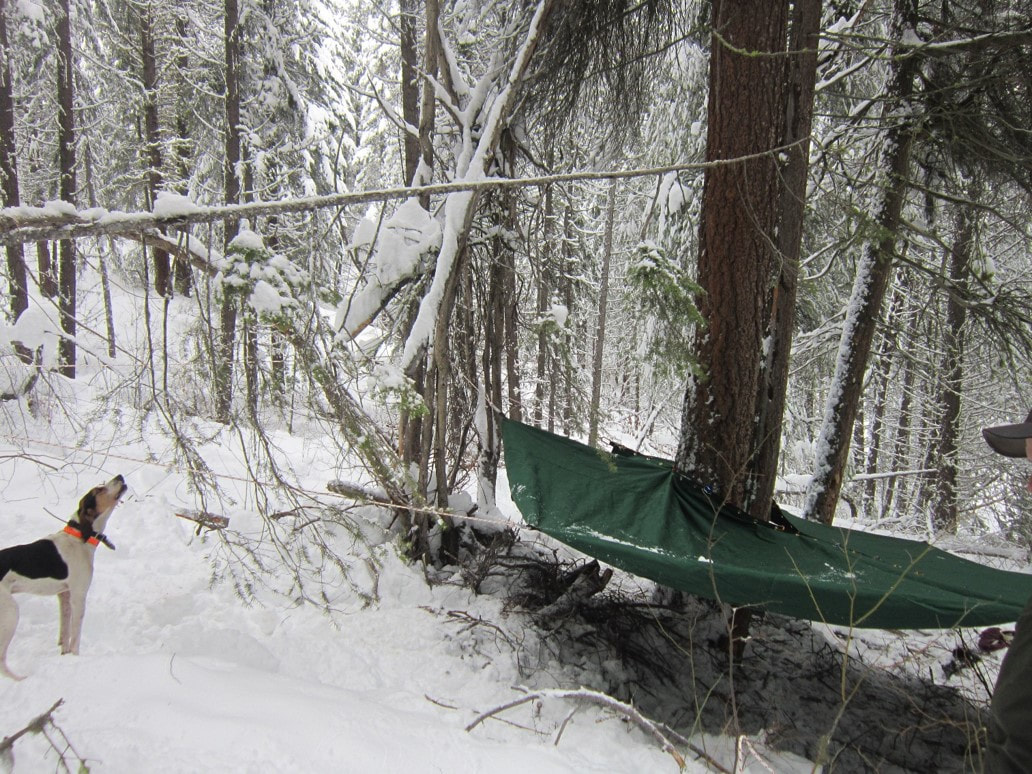
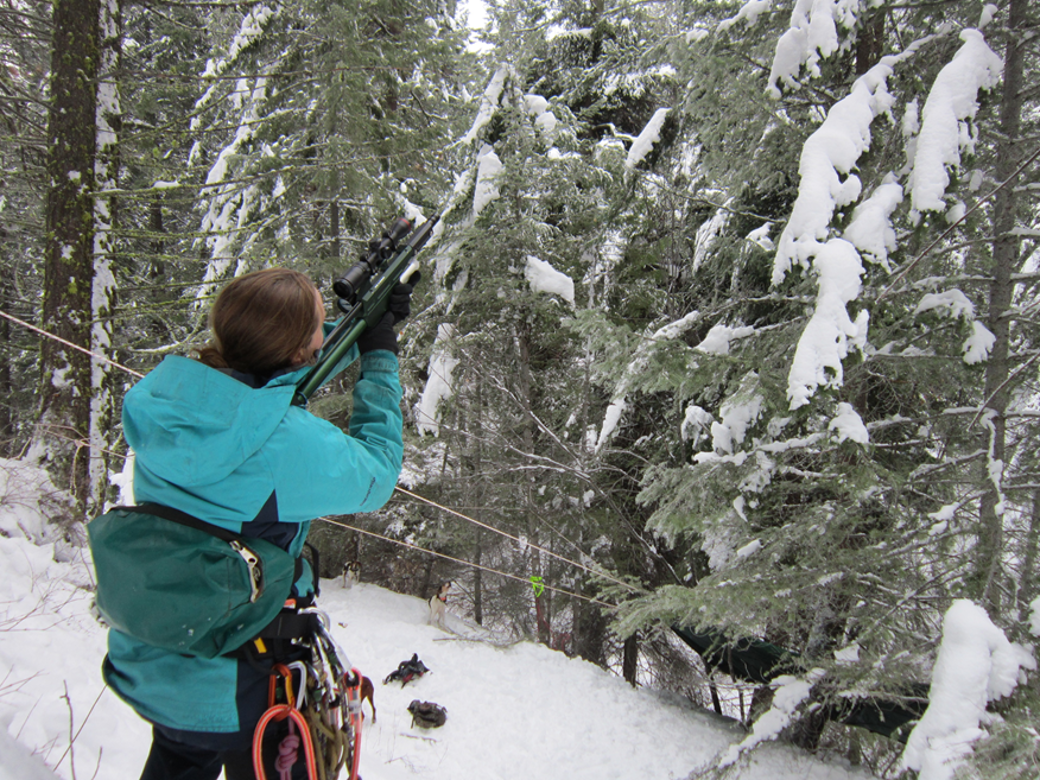
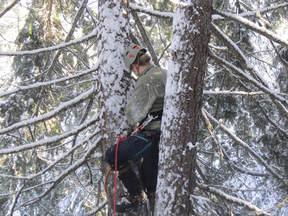
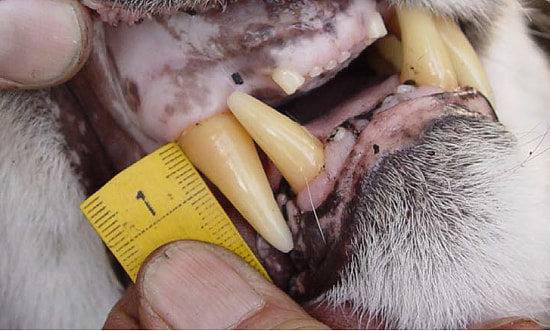
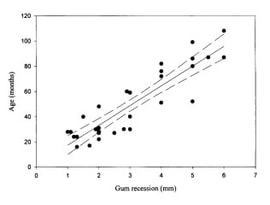
Cougars often walk down roads or cross them, so we spend the bulk of each capture day searching roads for fresh tracks. When we find tracks, we want to make the chase as short as possible for both the cougars and the hounds. We do as much of the work as we can ourselves, following tracks to see if they cross another road farther on or circle back on themselves, before letting the four-legged canine experts on the trail. Once a cougar climbs up a tree we move the pursuing hounds back, set up a safety net to catch a potential fall, dart the animal with an anesthetic, and climb up the tree to lower the anesthetized cat to the ground. We weigh the cougar and then estimate its age based on a method called gumline recession. Older animals have a larger gap between the gum and where the canine tooth begins to taper.
Then, we affix small ear tags with an identification number to each ear and attach a global positioning system (GPS) collar that will allow us to track the animal for two to three years. After approximately 45 minutes, the cougar slowly begins to wake up and we leave. We surpassed our goal and put out seventeen new collars last winter, bringing our total to thirty-three cougars collared so far!
Summer field work recently came to a close for the Washington Predator-Prey Project. For my research (see community dynamics), this entailed deploying camera traps across both study areas to photo-capture medium- to large-bodied carnivore and ungulate species. After completing this first field season of my PhD work, I’ve come to appreciate the charms camera trapping has to offer. 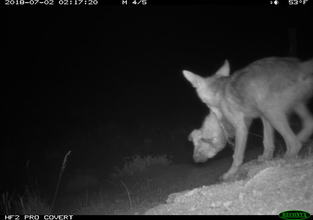 A coyote pup carrying a yellow-bellied marmot. A coyote pup carrying a yellow-bellied marmot. The obvious perk of camera trapping is the incredible images you end up with. Given that we have 120 cameras placed across the two study areas and will leave them out year-round for the next 2 years, we will have quite a collection for photos by the end of the study. Each photo-capture of an animal gives us a wealth of information including the location, date, and time at which the animal was observed, the habitat it was using, and possibly even its age, sex, the number of individuals in its group, or behavior at that moment. In addition, because any passing animal will trigger a camera trap, we will end up with information on a wide variety of species. This is a huge advantage of camera trapping because we can collect data on multiple species with minimal additional effort.
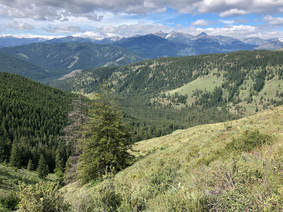
To top it all off, we get to explore some of the most incredible places eastern Washington has to offer as we travel to and from the camera traps. This technology allows us to collect detailed data over large areas while still getting us out in the field to enjoy and appreciate Washington’s diverse ecosystems. We’re thrilled with the data we’ve collected up to this point and look forward to what we will catch on camera in the years to come.
-Sarah Bassing
|

 RSS Feed
