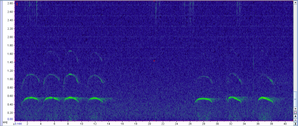
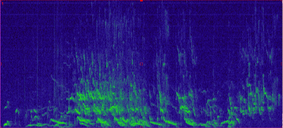
Wolf howls have a unique frequency range and characteristic shape, making them easy to detect visually when we look at a spectrogram (a graph of the sound frequencies; see below for example). This allows us to easily examine sound recordings for signs of wolf presence (we will collect ~63,000 hrs of recordings in 1 summer, which would take over 7 years to listen to them all). In fact, after collecting recordings of the sounds, we can process these data using machine learning techniques which automatically identify likely wolf howls. This means we don’t actually listen to any of the sounds except to verify the “howls” returned by the machine learning program. Interestingly, coyote howls, which you might think could be confused with wolf howls, have a rather different frequency and thus it is often easy to distinguish the two without listening to the recording.
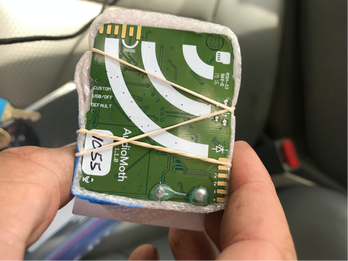
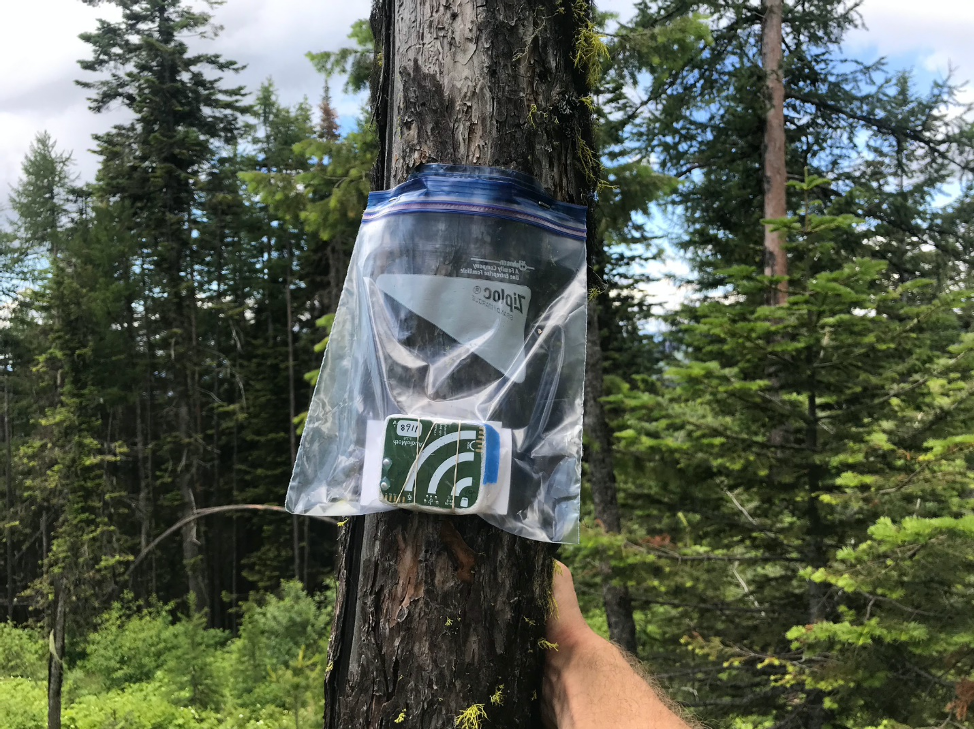
Once we process the data, we can use the recorded howls to start to understand different aspects of wolf populations. First, we will learn when and where wolves are howling across the landscape. This can help identify new packs in new locations. Second, we can look at the spectrograms and identify how many unique wolves are howling in any recording, which can provide a minimum count per pack. And finally, we can also determine the presence of pups in the pack through their own unique howl frequency, which can provide information on recruitment. These are all rates that that have proven challenging to monitor through collaring and camera trapping, but we hope to incorporate AudioMoths as a new inexpensive tool to monitor wolves on larger spatial areas with greater efficiency while improving our confidence in some of those population metrics. 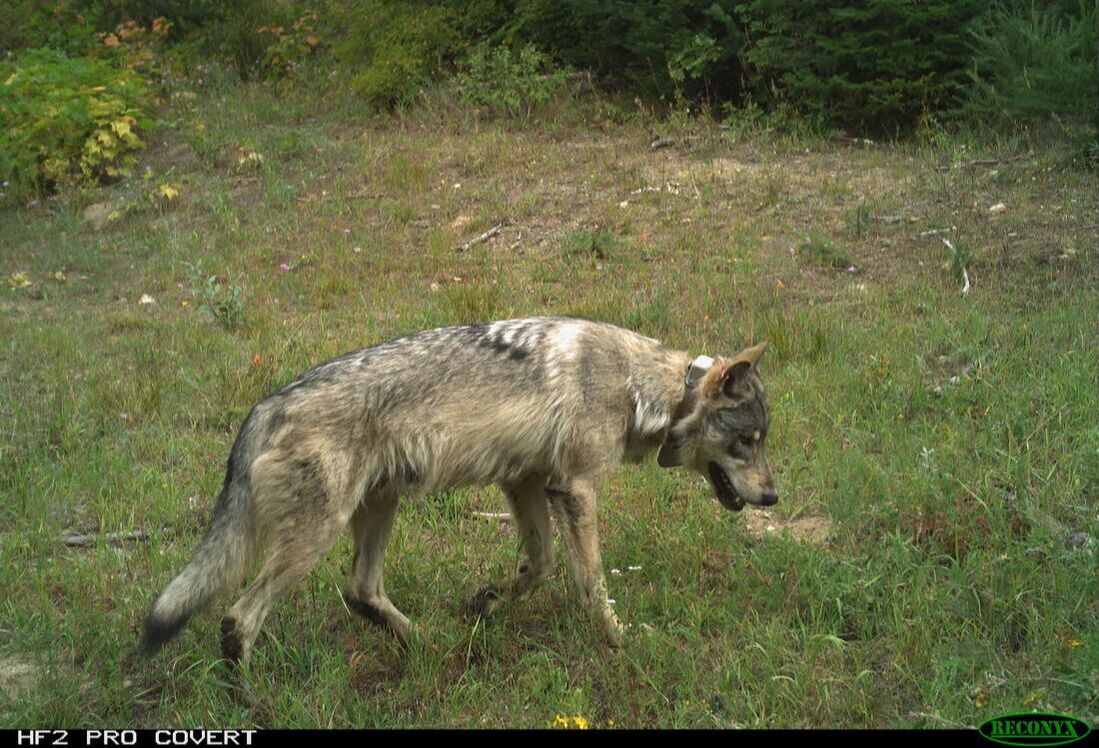 This radio-collared wolf was detected by both a camera and AudioMoth last summer, allowing researchers to compare techniques for monitoring wolves.
4 Comments
|
 RSS Feed
